
2
0
4
6
8
10
2021 Q4
2020 Q4
2019 Q4
2018 Q4
2017 Q4
2016 Q4
2015 Q4
2014 Q4
2013 Q4
2012 Q4
2011 Q4
2010 Q4
2009 Q4
2008 Q4
2007 Q4
2006 Q4
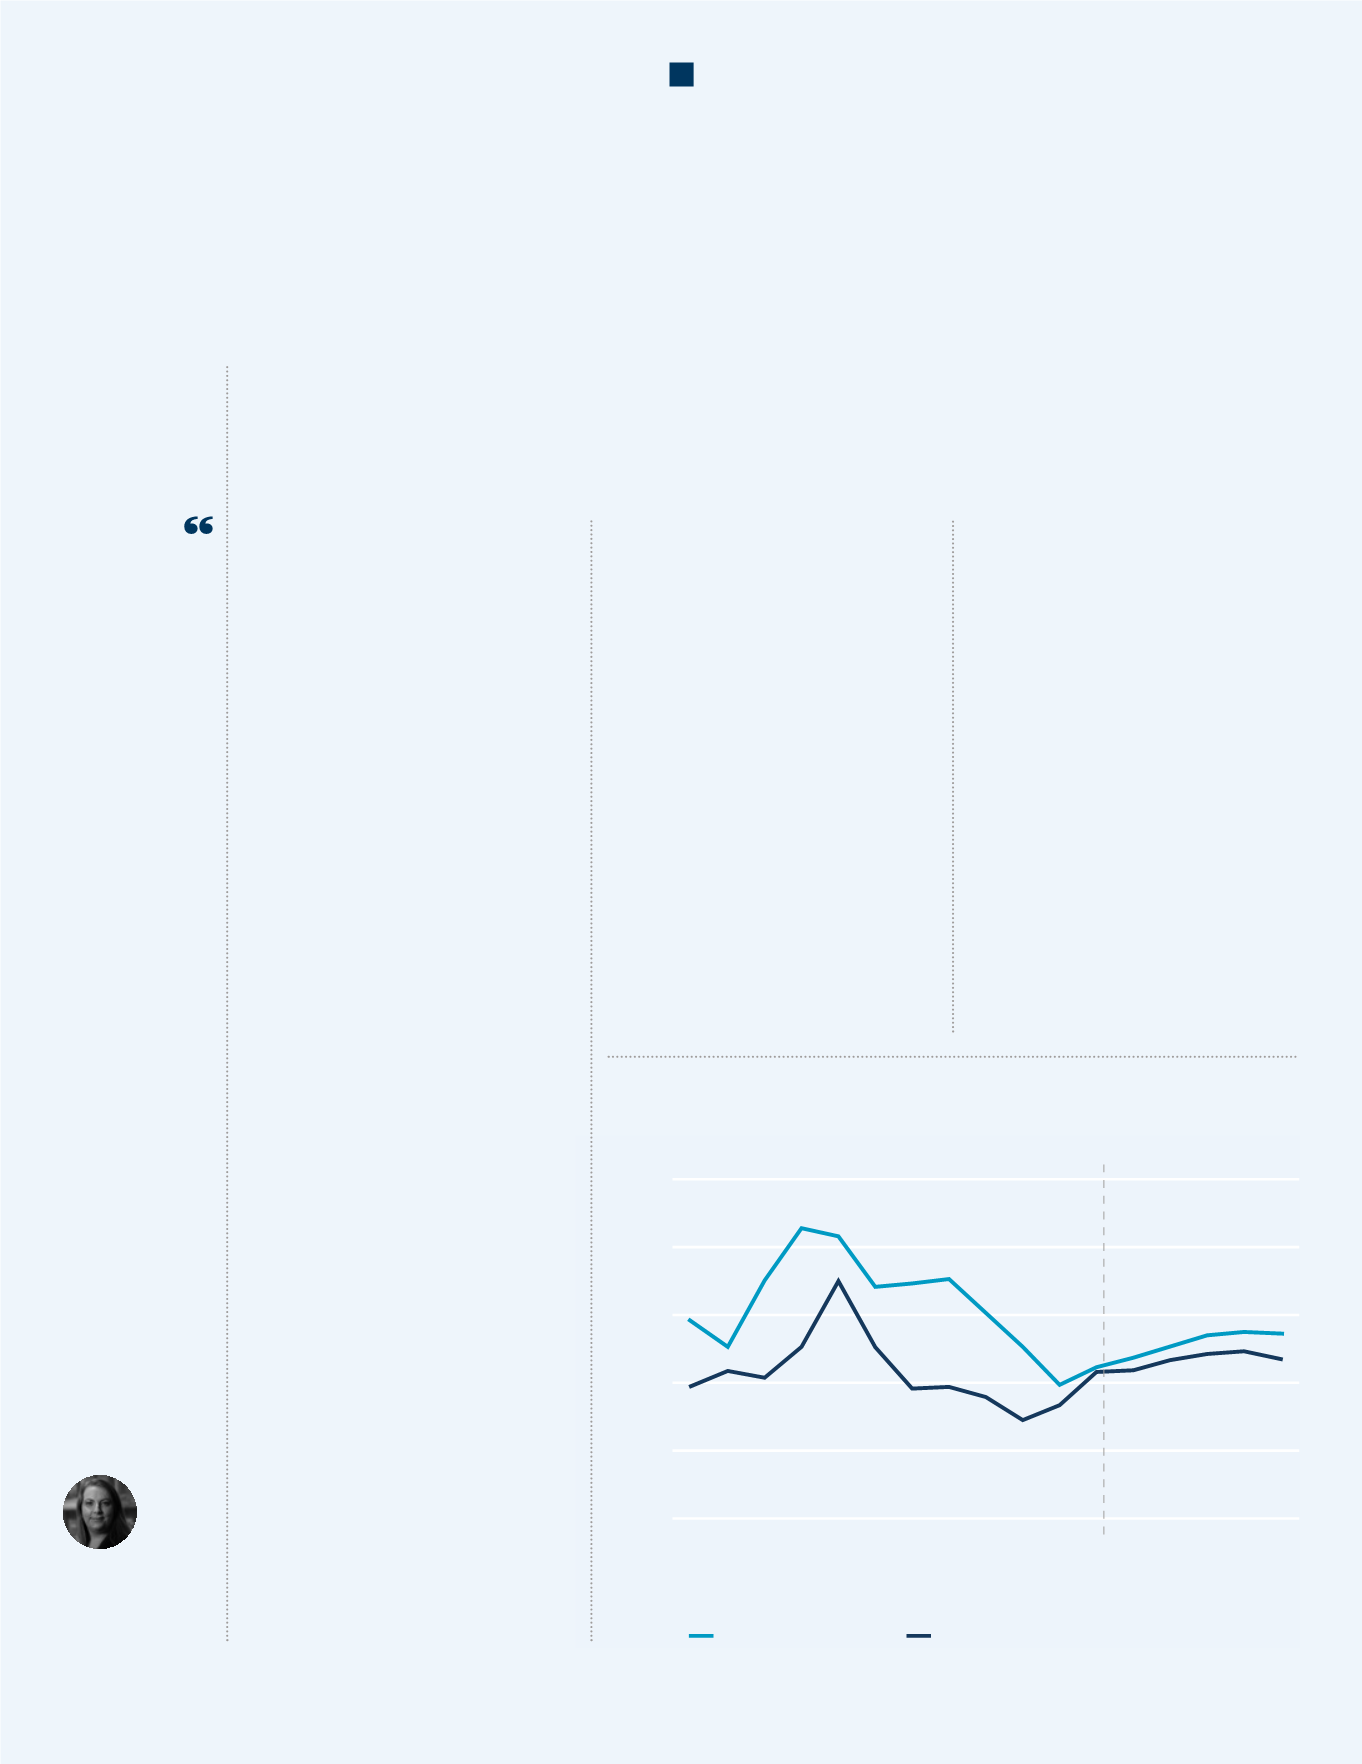
Vacancy Rate (%)
City Vacancy Rate
West End Vacancy Rate
Supply levels have increased across
the capital during 2017, to reach
13.5 million sq ft at the end of
April. This increase (16%) was to
be expected due to the pipeline of
new developments approaching
completion, (a total of 1.9 million
sq ft is now within 6 months of
completion - but this also reflects
the geographical expansion of
Central London to include White
City). Nevertheless, high levels of
pre-let space (around 48% of space
completed in the 18 months to 2017
Q3) has helped to alleviate the
impact of new completions.
The volume of speculative space
under construction contracted
quarter on quarter by around
700,000 sq ft and the speculative
pipeline remains relatively
constrained into 2018. Eight million
sq ft of completions are expected
in 2017, but the majority of this is
already included in supply data and
therefore its impact has already
been felt. 2018 could see up to 8.5
million sq ft delivered, albeit at this
stage only 6.3 million sq ft is under
construction. Currently, 61% of space
already under construction has been
pre-let or is under offer, leaving just
2.4 million sq ft of speculative space
under construction. This suggests
that there is potential for the recent
upswing in supply to be reversed
in the short term, even allowing for
an increase in second hand space.
Beyond 2018, there is scope for an
upswing in development completions
but much will depend upon the
confidence of developers and
available funding in these uncertain
political and economic times.
We have already seen an uplift in
sublet space across Central London
with 3.1 million sq ft available at
the end of Q1 compared with 2.1
million sq ft during the same period
last year. Much of this sublet space
was as a direct result of changes in
business strategies and M&A activity,
By Hayley
Armstrong,
Research Analyst,
London Markets
Rising Supply –
a Threat to theMarket?
Beyond
2018, there is
scope for an
upswing in
development
completions
Central London Vacancy Rates
for example, rather than as a direct
result of the vote to leave the EU, we
estimate that sublet space currently
accounts for 24% of supply; which
while seemingly high, is virtually on
a par with the average proportion
since 2009 (and only falling back
to volumes recorded as recently
as 2015).
There is likely to be further
tenant-sublet space brought to the
market as occupiers reassess their
holdings in relation to the changing
business environment. However, we
also anticipate a proportion to be
taken up by cost sensitive tenants
who continue to pursue value or
seek short-term overflow space. It is
useful to note that over half (54%)
of the sublet space currently on
the market is available for a term of
less than five years and in absolute
terms this is at a similar level to the
volume of short term space that has
been let over the last 12 months.
Sublease space has a part to play
in the market. This is certainly true
as economic uncertainty, coupled
with the cost of relocating and the
relatively limited choice particularly
for larger companies, has supported
the trend for overflow space rather
than committing to a full-scale
move. To date in 2017, 16% of leasing
volumes have been for sublease
space, of which two thirds, by both
volume and number, have been for a
term of less than 5 years.
Looking forward, the market
appears relatively insulated from
any significant supply side shocks
with limited volumes of speculative
development due online over the
next 18 months and some schemes
pushed back, but not cancelled. As
a result, although we expect supply
to trend upwards, it will be at a
relatively benign rate.
CUSHMAN & WAKEFIELD
24
LONDON IN FIGURES


