


 26 / 40

Central London leasing activity
continues to surprise with quarter on
quarter uplifts and above average
volumes recorded across the capital.
While aggregated figures tell one
story, the underlying data provides a
different narrative.
Confounding post referendum
expectations, the number of
transactions in 2017 above 100,000
sq ft is 20% above the 5-year average,
with 11 transactions above that
threshold in the year to date. This
demonstrates the continued attraction
of London post Brexit and occupier
confidence to make wholesale moves
and consolidations. The pre-let market
accounts for 68% of the deals above
100,000 sq ft in the last five years,
and 73% of 100,000 sq ft+ deals in
2017 so far. This suggests long term
commitment to London from a diverse
occupier base.
A number of high-profile leasing
transactions, such as Deutsche Bank
at 21 Moorfields (469,000 sq ft),
WeWork at Two Southbank Place
(283,000 sq ft) and Boston Consulting
Group at 80 Charlotte Street (124,000
sq ft), are making headlines but it
is important to remember that the
smaller occupier market has always
supported activity levels.
Both the 10,000-25,000 sq ft and
25,000-50,000 sq ft brackets have
seen an upturn in activity during
2017, with above average numbers
across Central London particularly
for transactions above 25,000 sq ft.
The area of concern is the
reported thinning of the bottom end
of the market, especially transactions
of 5,000-10,000 sq ft. The number
of transactions recorded this year in
this size band was down 11% against
the 5-year Q1-3 average while as
a percentage of the total number
of transactions, there has been a
gradual downward trend over the
last five years. There is a perception
that this ‘hollowing out’ would be
more prevalent in the West End
market, but the data confirms the
opposite; there were 80 transactions
of 5,000-10,000 sq ft in Q1-3 2017,
which is directly in line with the
5-year average for the West End.
By Christopher
Dunn,
Senior
Insight Analyst
Size Band
Analysis
Persistent
growth from
the office as a
service sector
surely raises
the potential
for further
pressure on
the smaller
end of the
market
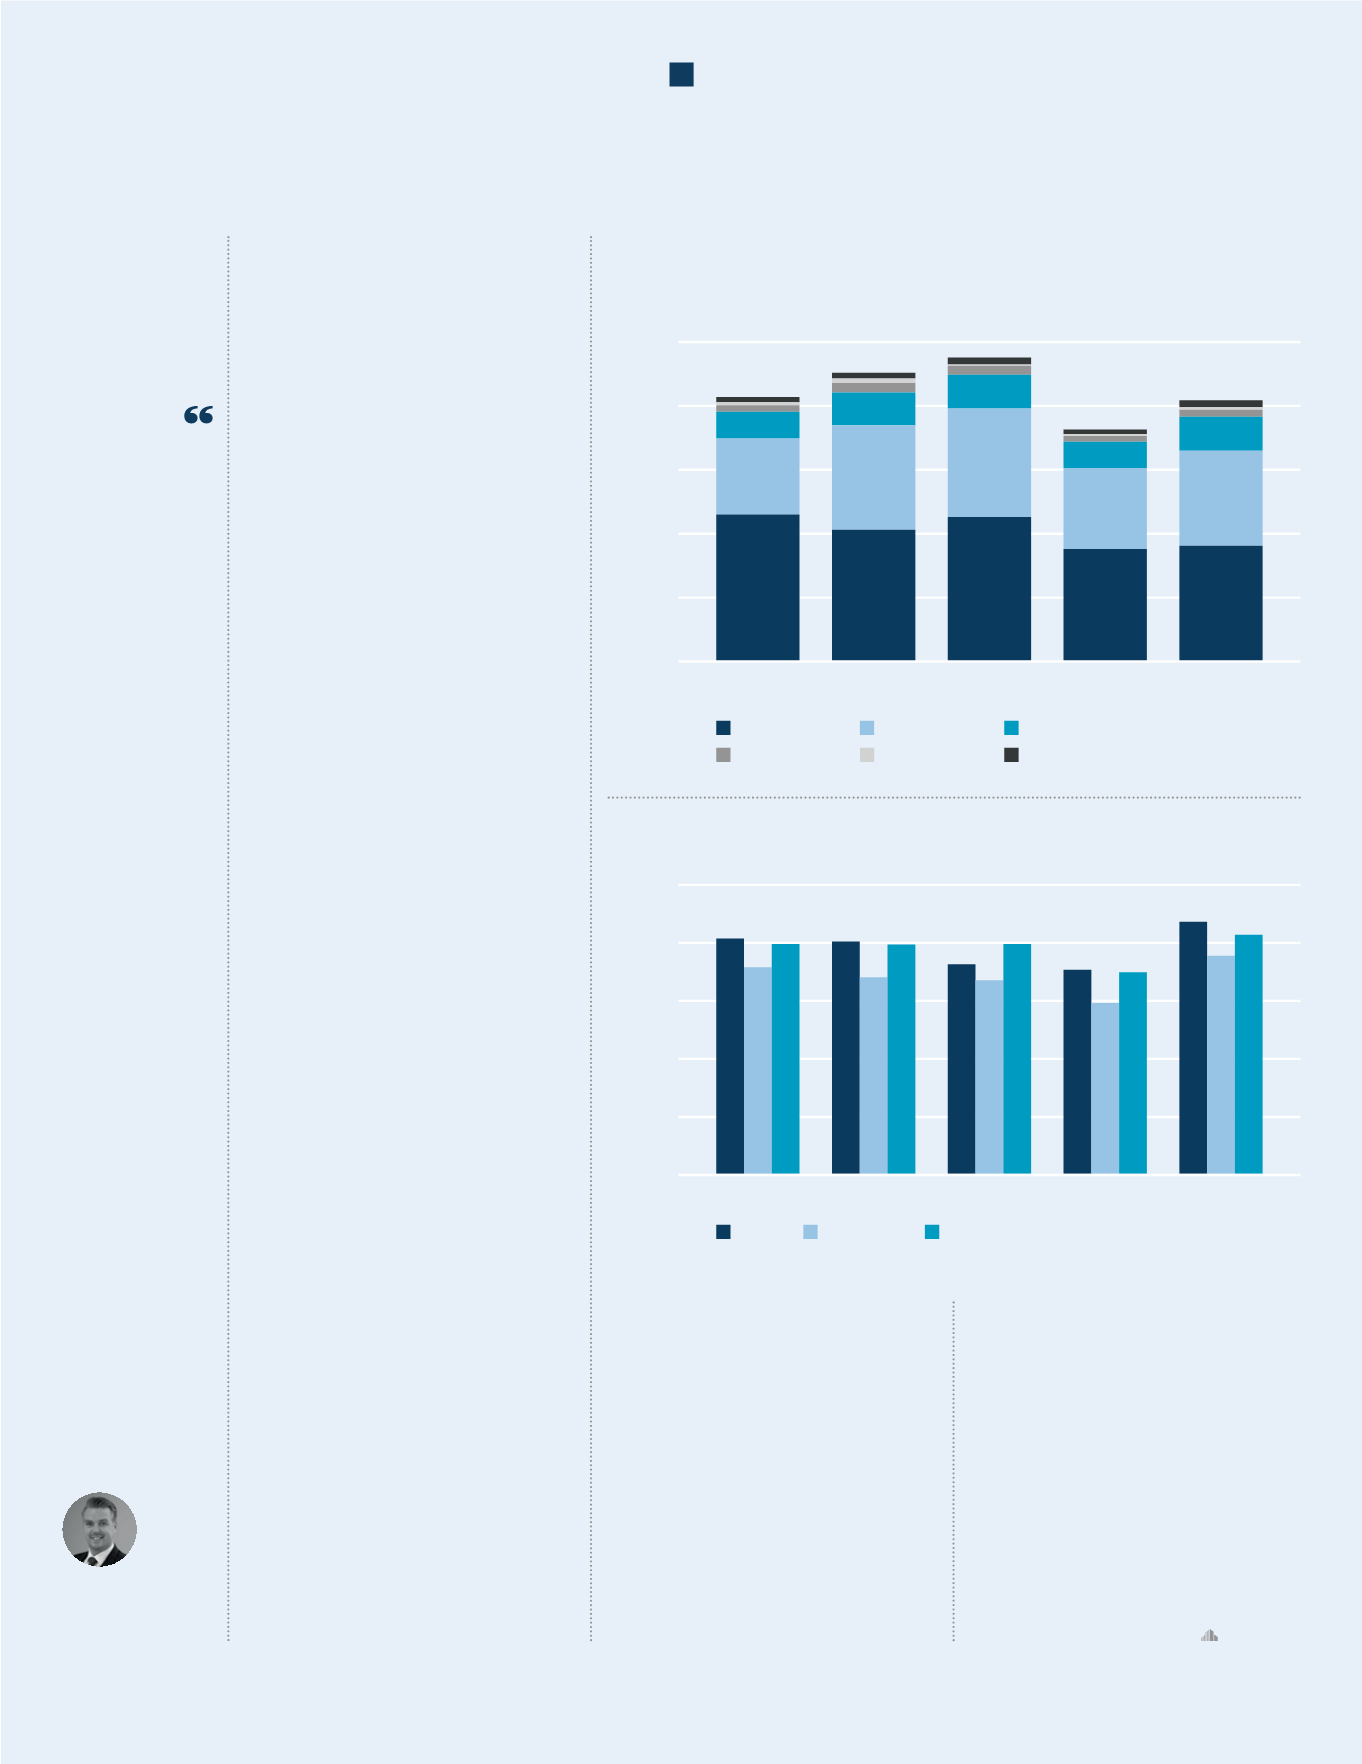
Average Transaction Size by Market (sq ft)
Central London Transactions by Size Band for Q1-3
(over 5,000 sq ft)
Because of these size shifts, the
average transaction size in Q1-3 2017
was 20,620 sq ft, some 4% higher
than the 5-year average deal size
(19,807 sq ft).
The above analysis concentrates
on all transactions above 5,000
sq ft. Whilst there have been 409
leasing transactions above 5,000
sq ft in 2017 YTD, there have been
928 below that threshold in the
same time period. The sub-5,000
sq ft market in Central London
accounts for 69% of transactions
(by number) but only 19.8% by
volume. The number of these small
transactions is also down year on
year, supporting the two-tier market
being observed between large and
small transactions.
It is potentially too early to
make any concrete conclusions
about whether this shift in deal
size distribution will continue, but
persistent growth from the office
as a service sector surely raises the
potential for further pressure on the
smaller end of the market. There is
of course continued political and
economic uncertainty, which could
impact the frequency of larger
transactions in the future.
0
100
200
300
400
500
5,000-9,999
Number of CL Transactions
2013 Q1-3
2014 Q1-3
2015 Q1-3
2016 Q1-3
2017 Q1-3
10,000-24,999
25,000-49,999
100,000+
50,000-74,999
75,000-99,999
0
5,000
10,000
15,000
20,000
25,000
City
2013
2014
2015
2016
2017
West End
Central London
CUSHMAN & WAKEFIELD
26
LONDON IN FIGURES